K2X.Tech
Living in Australia while working remote as a UX/UI designer for the Pakistanish tech company K2X.Tech.
At K2X.Tech I was working as a remote UX/UI Designer while I was living in Australia for five months.
My primary role was to brainstorm different ways UI elements could look while using design thinking.
I worked on different project where I contributed with research, ideation, brainstorming, wireframes, mockups and feedback on designs.
Furthermore, I worked with Figma where I developed my UI/UX skills and understanding of a user-friendly user journey.
My role as UX/UI Designer
Projects
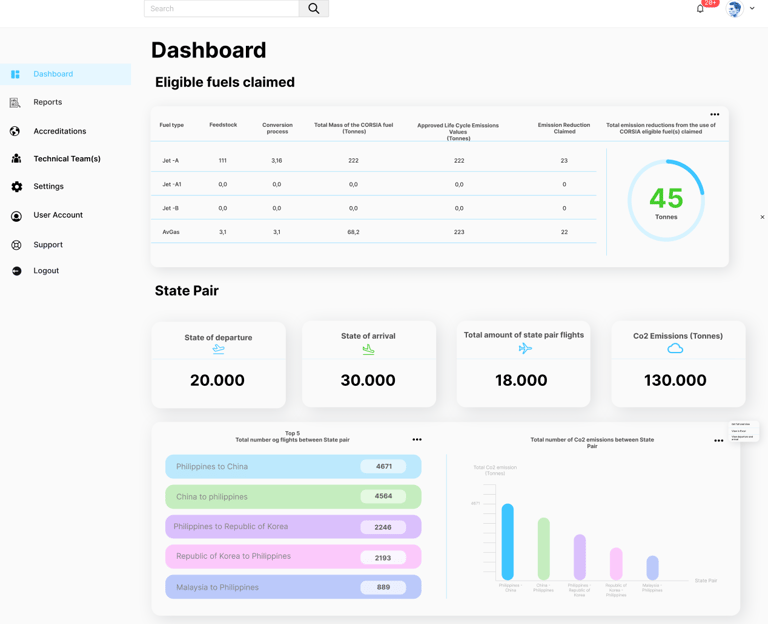
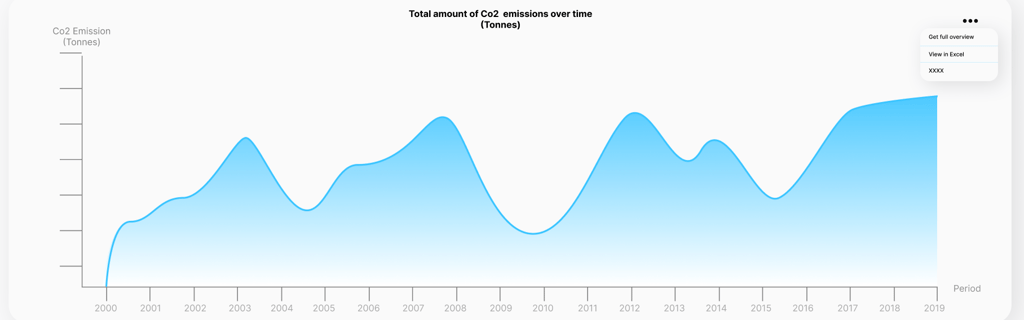
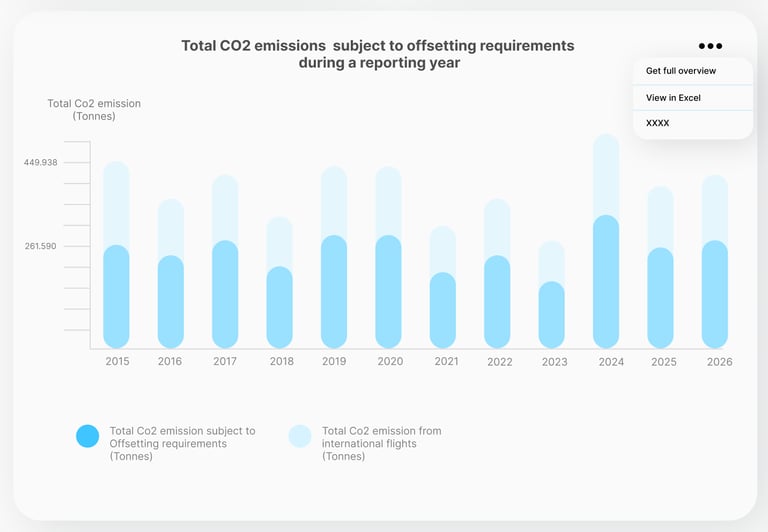
My biggest project was working on a dashboard, where the user should be able to view multiple flights, the flights fuel type, arrival and departure and also the amount of CO2 the individual flights emits.
Here I got to develop many different ways of showcasing data in different ways to make the data useful and understandable for the user.
Design Thinking
In my design process, I employed the principles of design thinking to tackle the challenge of representing data effectively on a dashboard.
Here's an overview of how I incorporated design thinking, sought feedback from coworkers, and used Figma to iterate.
Empathize and Define:
I began by understanding the needs and expectations of users who would interact with the dashboard, which helped define the problem and set clear objectives.
Feedback Loop:
Regular feedback sessions with coworkers were great in refining the dashboard's design. Their input not only helped me spot potential usability issues but also provided fresh ideas for improvement.
Ideate:
I conducted brainstorming sessions to generate a wide range of ideas for data representation.
This involved exploring various chart types, visual styles, and interaction concepts.
Prototype and Test:
Using Figma, I created mockups of different dashboard designs. This allowed me to quickly visualize various concepts with minimal effort.
I involved my coworkers and gathering their feedback and insights. Their diverse perspectives helped identify strengths and weaknesses in each design iteration.
Iterate and Refine:
Based on the feedback received, I iterated on the design, making necessary adjustments and refinements.
This iterative process allowed me to fine-tune the dashboard's layout, data visualization, and user interactions.
Develop Skills in Figma:
While working on the project, I trained my skills in Figma, using its collaborative features to incorporate feedback from coworkers and make real-time changes to the mockups
I also explored advanced features and plugins within Figma to enhance the design.
Result:
By embracing design thinking, seeking feedback from coworkers, and leveraging Figma's capabilities, I created a data dashboard that not only met user needs but also pushed the boundaries of my design skills.
This iterative and collaborative approach ultimately led to a more effective and user-friendly solution.